The National Plant Monitoring Scheme (NPMS) team are very happy to announce the launch of a new interactive page on the website (www.npms.org.uk/trends) showcasing the current trends from NPMS data.
The page displays interactive graphs illustrating how the average percentage cover of a species across all survey plots within an NPMS fine-scale habitat has changed by year. The species included are the NPMS positive and negative indicator species for each habitat, recorded across the three survey levels available (Wildflower, Indicator and Inventory).
Why not take a look and see how different indicator species are faring in different habitats - for existing volunteers, does this match the experience in your own survey squares?
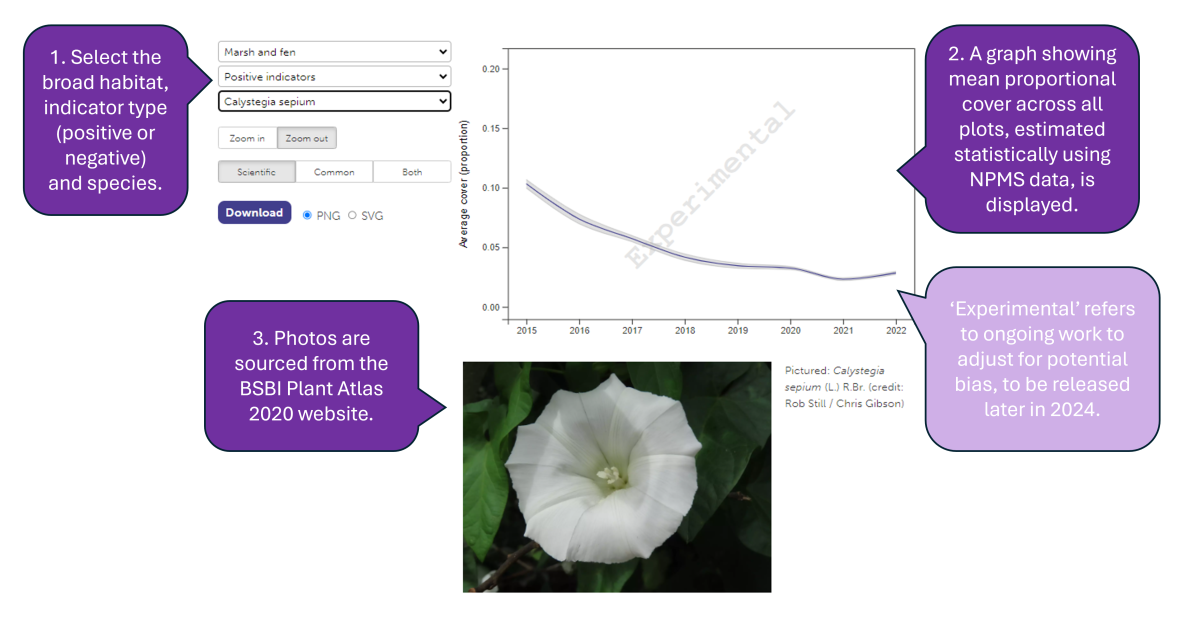
The statistical models used to produce these trends follow the approach used to create the C7 "Plants of the Wider Countryside" indicator within the Defra/JNCC UK Biodiversity Indicators. The technical background to this model is available in this report, and the model code in the JAGS language is available here.
These statistics are currently classed as "experimental", reflecting that the broad-habitat level indicators based on them are not currently accepted as "Official Statistics" within the UK Biodiversity Indicator set. Work is ongoing to adjust these measures for inter-annual variability in geographic sampling biases.
The process by which the NPMS positive and negative indicator species for each habitat were selected is described by Pescott et. al (2019) here.